(This is the last in a series on this subject. Earlier graphs are replaced herein).
Modern research shows a precipitous decline in insect numbers worldwide in response to climate change and agricultural practices. For the frightening details, see the Guardian’s overview of the major reports (https://www.theguardian.com/environment/2019/feb/10/plummeting-insect-numbers-threaten-collapse-of-nature). The current study adds data to this general question, and includes 232 visits to the site (Bear Creek) across 21 sampling years from 1998 through 2020.
Observations were made along a haphazard transect (a road) about 1 km long from the caretaker’s house at the parking lot to the Specimen Rock trailhead and about 150 m beyond. The average hike spanned between 1½ and 2 hours, and the sampling time was recorded in every case.
Forty-six species were chosen from the 125 that have been found at the site. These species are generally widespread, found almost every year, and do not tend to produce population explosions. Formerly rare species such as Amblyscirtes eos, Brephidium exile, Junonia coenia, and Adelpha eulalia were excluded because they are moving into the region in numbers as of the last five to seven years. These, of course, show increasing numbers.
Butterfly abundances are recorded in terms of numbers observed per hour, and the average for each year is recorded for graphing purposes. Thus, the graphs show the annual average abundances as a function of years. Slopes are plotted for each data set, and although none of the effects approach linear, the slopes are shown to address the general trends across the years. The broad scatter is due to many factors, including climatic and weather conditions, experimental error, and the natural fluctuations of populations.
Most butterfly species in the American West are highly adaptable to wide swings in weather conditions, making them resilient against changes in climate. Regional land use is generally innocuous in terms of butterfly dynamics, neither encouraging nor discouraging population development. In comparison with agricultural regions, Pikes Peak has generally escaped the deleterious affects of pesticides, herbicides, and monocultural practices. Nevertheless, populations are beginning to show a slow decline across all butterfly families, the overall average slope being y = – 0.028x, suggesting a very slight decline in numbers across the 20 years.
Disturbance at the site has been minimal and unchanged until the spring of 2020, when a mitigation effort was initiated to assist in the management of the protected green-backed cutthroat trout. The changes affected mainly the upper south slope, destroying a significant stand of Monarda fistulosa, a mint, the flowers of which are highly attractive to butterflies, especially some members of the family Hesperiidae and the Nymphalid genus Speyeria. The numbers of these groups were not affected in 2020, probably due to the numerous other nectar sources available. Graphic results follow.
HESPERIIDAE:
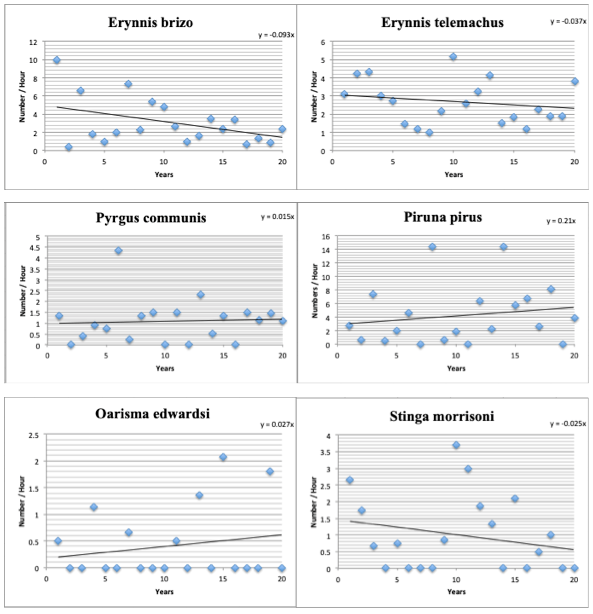
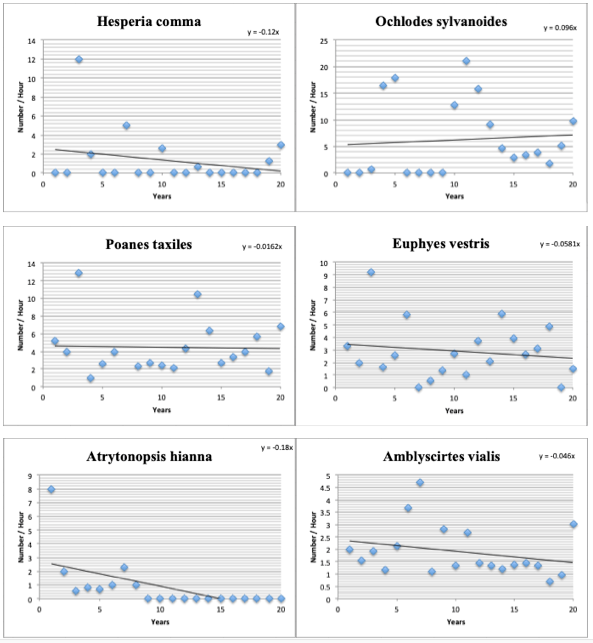
Mean slope : y = – 0.0292x
PAPILIONIDAE:
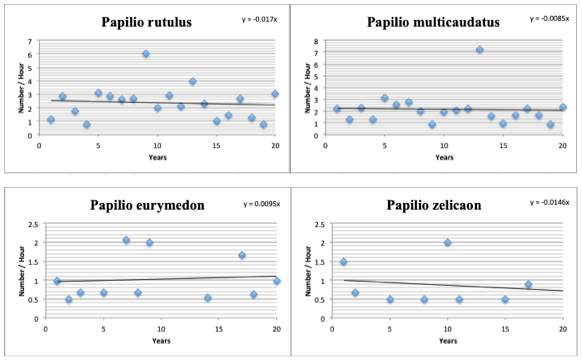
Mean slope : y = – 0.0124x
PIERIDAE:
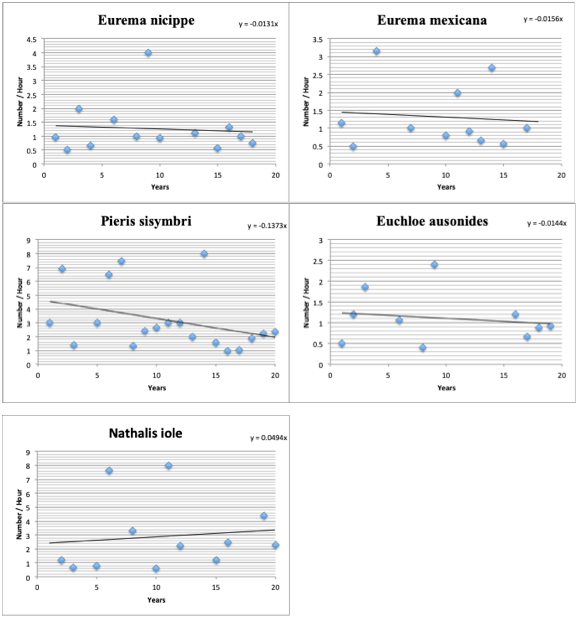
Mean slope: y = – 0.046x
LYCAENIDAE:
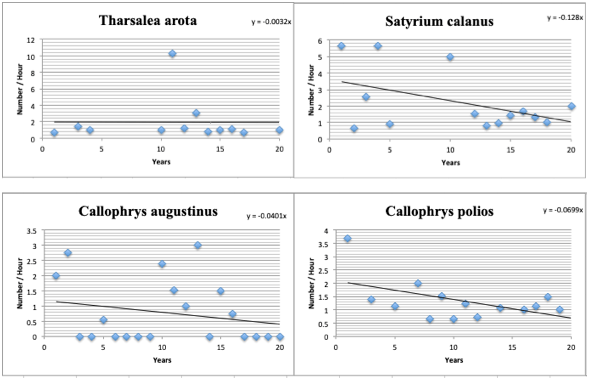
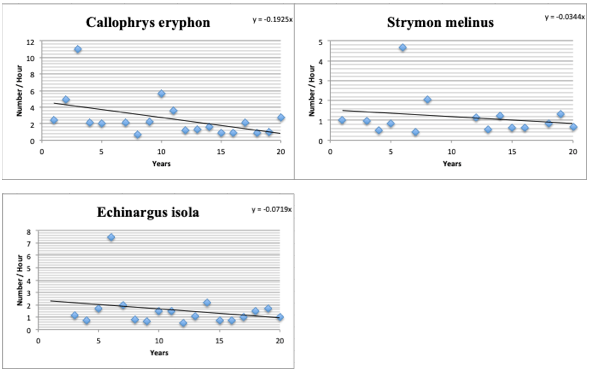
Mean slope: y = – 0.077x
NYMPHALIDAE:
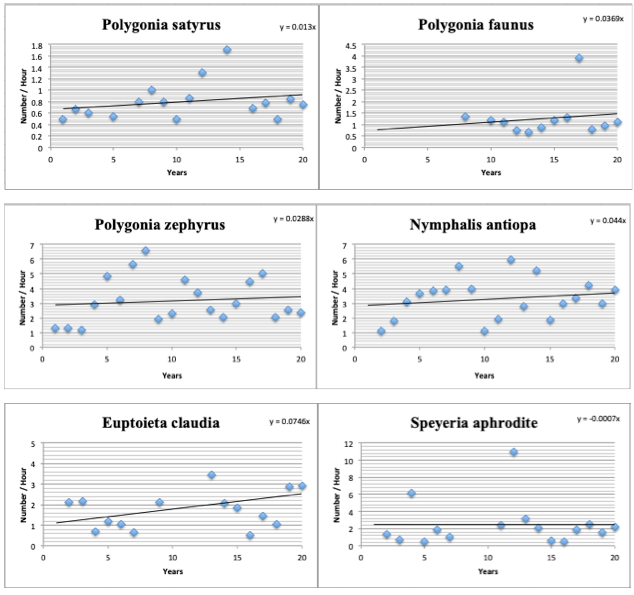
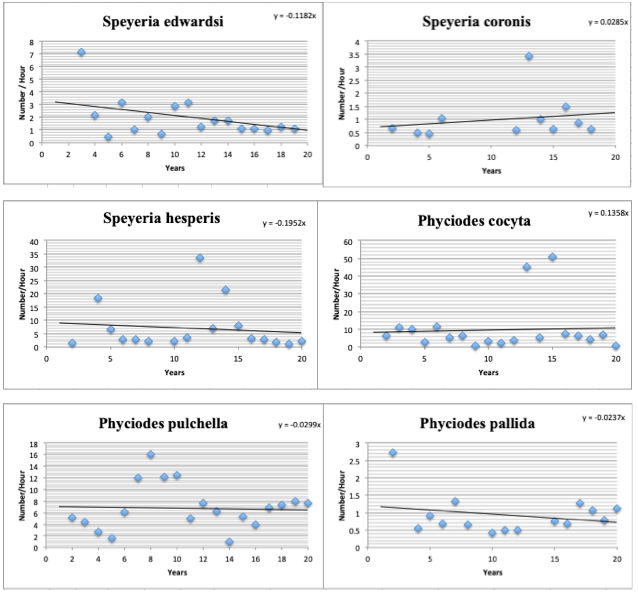
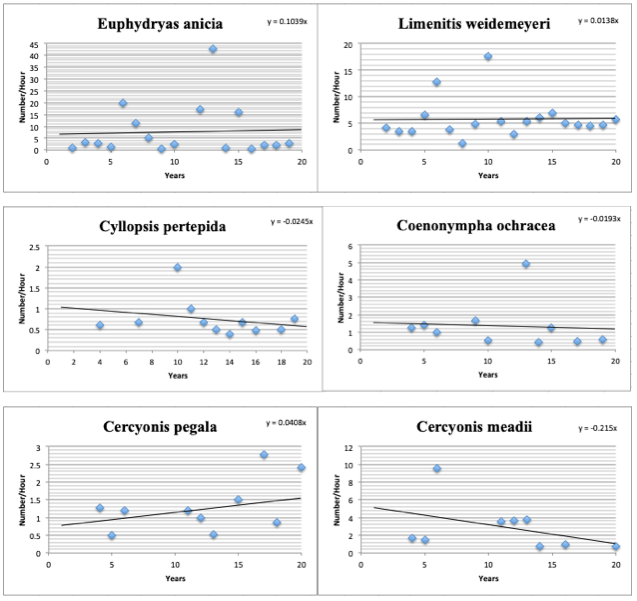
Mean slope: y = – o.oo64x
The interpretation of these data is difficult, of course, but the general trend is that butterfly populations are stable across this period. Out of the 46 species studied, 32 (70%) show negative trends. The very slight downward slope is suggestive and holds for every group. Other studies (posts below) show a loss of total numbers of butterflies, and a loss of species diversity across the same time period.
